Introduction
Variance analysis is the most important tool for budgeting and control cycles for any company. A total sales variance indicates the under or over sales in comparison to the target sales. Total Sales variance comprises two main parts of Sales Price Variance and Sales Volume Variance. The Sales volume variance can be further analyzed in two parts for the sales quantity variance and the sales mix variance. In this article, we will cover in detail about the sales quantity variance. The relationship between these variances is shown below:
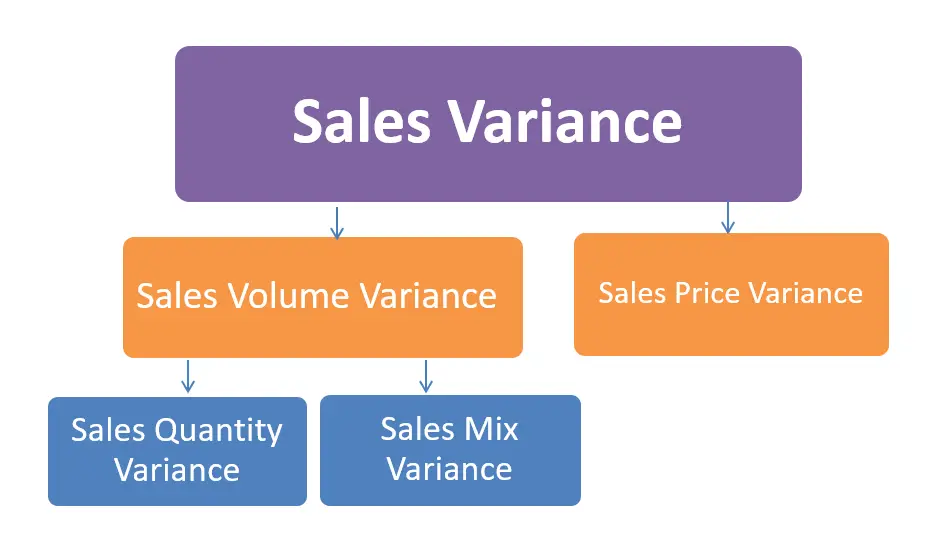
Table of contents
Definition
The sales quantity variance can be defined as:
“The change in contribution margin or profits with the change in the actual sales quantity in comparison to the budgeted sales quantity”
As the relationship shows the variance in sales volume can be caused by a change in the total number of units sold and/or the changes in the price.
Sales Quantity Variance Formula
The formula for such variance is as follow:
Sales Quantity Variance = (Actual Quantity Sold × Standard Profit) – (Budget Quantity × Standard Profit)
Or Sales Quantity Variance = (AQ × SP) – (BQ × SP)
The standard profit will depend on the costing approach as it can be used as the contribution margin or the Profit per unit.
The standardized form formula for the variance remains the same:
Sales Quantity Variance = (Budgeted Sales – Actual Units Sold) × Standard Profit
Where standard profit or standard contribution can both be used
The sales quantity variance is directly linked with sales mix variance, so the total sales volume variance should be analyzed keeping both measures in mind.
Example Calculation
Suppose Techno Blue produces 02 different products in different quantities and sells them for different prices. With the given information as follow:
| Product | No. of Units | Unit Price |
| Actual Data: | ||
| Product P1 | 7,500 | $ 6.00 |
| Product P2 | 2,500 | $ 10.00 |
| Budgeted Data: | ||
| Product P1 | 7,000 | $ 6.50 |
| Product P2 | 2,000 | $ 9.00 |
Required: Calculate the sales quantity variance of the products above.
Solution:
We can calculate the variance of each individual product as well as the whole products as follow:
The standard Mix Ratio = for P1 = 7000 / 9000 × 100 = 77%
The standard Mix Ratio = for P2 = 2000 / 9000 × 100 = 23%
Total Budget unit sales = 7000 + 2000 = 9,000, Total Actual unit sales = 7500 + 2500 = 10,000
Unit sales according to sales mix for P1 = 10000 × 77 % = 7,700
Unit sales according to sales mix for P2 = 10000 × 23 % = 2,300
P1 Sales Quantity Variance = (7700 – 7000) × 6.50 = $ 4,550 Favorable
P2 Sales Quantity Variance = (2300 – 2000) × 9.00 = $ 2,700 Favorable
Total Sales Quantity Variance = $ 7,250.
Interpretation and Analysis
As we can see the sales quantity variance is an integral part of the total sales variance which compliments the sales mix variance. As we can see from the example above, the price fall in one product gives higher sales and a favorable variance. For the second product, both higher prices and a higher number of units caused a favorable variance. The product mix calculates the percentage of each product units in the proportion to equally divide the manufacturing capacity. It also gives the management an overview of each product sales production and price profitability capacity. In different scenarios, if a product fails to achieve the budgeted sales volume, it can still produce favorable variance with adjusting the price.
Advantages of using sales quantity variance analyses
Some of the advantages of using sales quantity variance analysis are:
- It provides in-depth analyses on demand and supply figures and the management can assess the real cause of change in the sales volume
- The management can use the product mix to maximize on profit-making products and reduce the production for loss-making products
- Total sales variance can be further categorized into sales mix and sales quantity to find out the real cause of favorable or adverse variance
- It helps management gain continuous process improvements
- It helps management in future price planning for the product mix
Once the management knows the right product mix and the number of units produced it can decide on several factors affecting the sales volume:
- Changing the production machinery to increase the production
- Increase in the Labor efficiency. For labor efficiency variance, you can refer to another article one “What is Direct Labor Efficiency Variance?“
- By assuring the availability of the raw materials
Sales mix and sales quantity variance analyses go hand in hand. In traditional variances, only the actual and budgeted sales volumes are compared. Modern variance analyses go one step ahead to decide which part of the sales volume is affecting the variance. The management may decide to revise their budgets after reviewing the sales volume variances. However, that needs a robust and flexible planning and control approach, where all the participants may agree on revising the budgets and set standards. The biggest hurdle in standard-setting or budgeting sales quantity is the availability of reliable historic data or industry standard data. In fast-paced technological environments, it is highly unlikely to gain access to successful standard inside data.
Limitations of the sales quantity variance analysis
There are some limitations of such analysis:
- such variance alone cannot determine the total sales volume variance
- It is suitable for highly standardized industry production with uniform processes and standard costing methods
- Modern and technologically advanced companies need more data to evaluate the correct sales volume variances which may change rapidly
- It may not be a suitable performance measure for a company producing Low-volume, customized, and sophisticated products.
- This variance may lure operational management to produce more products to achieve a favorable variance
- It may cause a conflict of roles if the performance measurement is based upon the sales quantity parameter alone, as the managers will try to manipulate the standard price and volume targets.
Conclusion
Variance analysis in general is implemented as a total quality improvement TQM approach. In a TQM approach, the management sets higher standards regularly in comparison to the market standard. So in case of Sales quantity budgets or standards, the set targets may change quickly with respect to both internal and external standards. Sales or revenue is the starting point of the income statement; hence it is one of the most important variance analyses for any company.
Caution should be taken when interpreting the results from such variance analysis. If the operational managers’ performance is appraised upon volume-based targets, they may forge the standards to achieve favorable variances. A sales mix and sales quantity variance in conjunction can provide a reliable starting point for budget revisions and control implementations. However, in customized production facilities and in automated production processes there is a little that management can change in regards to sales quantity variance.