Net assets are an important metric for equity evaluation for shareholders and lenders. Shareholders in particular are keener on evaluating the impact of their investment. Net assets are theoretically equal to the book value of equity of the shareholders. However, equity is always higher than the book value of net assets with goodwill and fair market valuation.
What is Return on Net Asset Ratio?
The Return on Net Assets or RONA ratio measures the financial metric of net income over its net assets. The net assets of a company include the total fixed assets and net working capital.
The terms net income refer to the net profits distributable to the shareholders or retained earnings. The use of net income figure compares the returns on net assets, i.e. all assets less the liabilities. Thus the ratio provides a useful interpretation of a company’s efficiency. The RONA ratio provides insights on important metrics indirectly such as working capital management.
How to Calculate Return on Net Assets Ratio?
Both balance sheet and income statement figures are used for calculations of the return on net assets ratio. Usually, the term fixed assets from the balance sheet exclude intangible assets such as Goodwill and Intellectual Property.
Formula:

Net Income = Net Profits after operating, Administration, Interest, and Tax Expenses.
Fixed Assets = Long-term tangible assets
Net Working Capital (NWC) = Current Assets – Current Liabilities
The notion behind excluding intangible assets is related to the contribution to the fair market value of equity. All intangible assets such as Goodwill contributes directly towards the share prices and hence the total equity of the shareholders.
The Return on Assets requires three main components to calculate the ratio. The net income figure is the Earnings after Taxes figure from the income statement. The Fixed assets are all non-current and long-term tangible assets from the balance sheet. Finally, we can obtain the net working capital by subtracting current liabilities from the current assets from the balance sheet.
Working Examples
Suppose a company ABC, states an annual net income of $ 130,000. Its current assets and current liabilities are $ 280,000 and $ 230,000 respectively. Its fixed tangible assets employed in the business are reported at the book value of $ 250,000.
The Return on net assets ratio can be simply calculated as:
Return on Net Assets = Net Income ÷ (Fixed Assets + Net Working Capital)
Net Working Capital = 280,000 – 230,000 = 50,000
Return on Net Assets = 130,000 ÷ (250,000 + 50,000)
Return on Net Assets = 0.433 or 43.33 %
Let us consider a real-world example of Walmart to calculate its Return on Net Assets Ratio.
For the Financial Year ended January 31, 2020, the financial figures from the Walmart statements are as below:
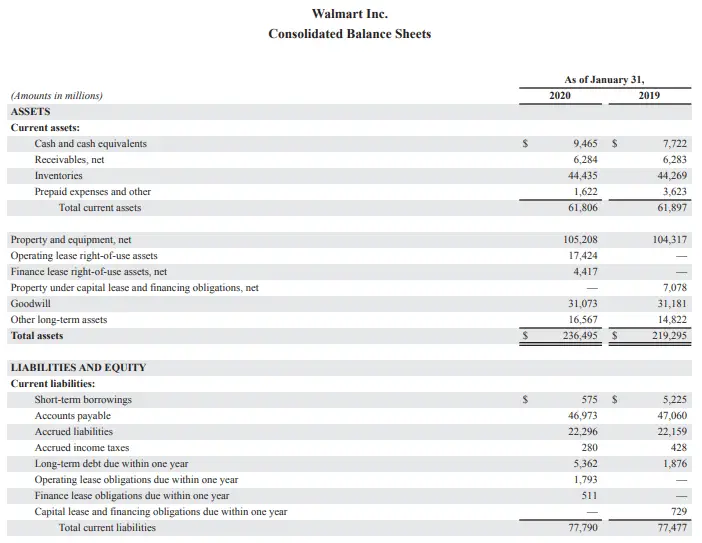
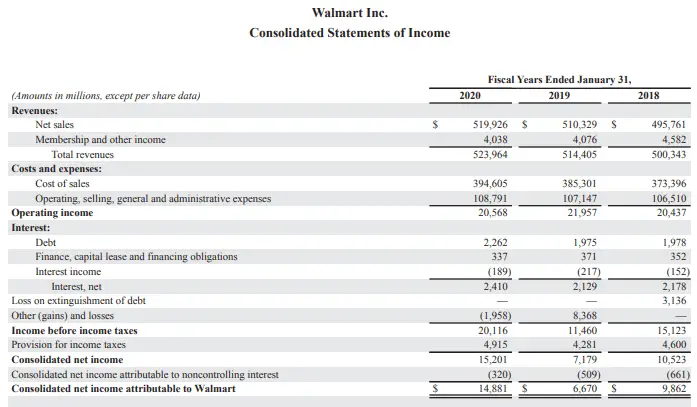
Source: stock.walmart.com
Walmart’s Net Income = $ 14,881
Fixed Tangible Assets = $ 143, 616; Excluding Goodwill = $ 31,073
Current Asset = $ 61,806 Current Liabilities = 77,790
Net Working Capital = – $ 15,984
Therefore, we can calculate the Return on Net Assets Ratio for Walmart as follows:
Return on Net Asset = Net Income ÷ (Fixed Assets + Net Working Capital)
Return on Net Asset = 14,881 ÷ {143,616 + (-15,984)} = 14,881 ÷ 127,632
Therefore, Return on Net Asset = 0.1165 or 11.65 %
Interpretation and Analysis
The Return on Net Assets ratio is a refined idea from the conventional return on assets (ROA). This ratio considers net profits against the net assets instead of on the total assets which also include intangibles. In a sense, it provides a net return on capital employed from the shareholders.
The Return on Net Assets takes into account the efficient utilization of a company’s fixed assets primarily. As it also considers the net working capital, it provides a useful analysis of the operational efficiency of a company. The use of net profits instead of revenue or margin provides the direct profitability ratio on net asset terms.
What is a good Return on Net Assets Ratio?
Like any other financial ratio, there is no one-fits-all answer to the indictor on this ratio as well. The best way to find out the good Return on Net Assets ratio is to compare it with historical performance. Industry standards within the same business sector can also provide useful information for benchmarking.
Let us move forward on our real-world example of Walmart Inc. As we can see from the previous year’s figures, its revenue and net income increased substantially. Although its net current working capital figure remains almost the same (- $15,580). The fixed assets less the goodwill also changes. The Return on Net Assets ratio for Walmart for the year 2019, comes out to be 6.02%. As the current year has seen a significant increase in Walmart sales, the net income increased substantially from $6,670 to $14,481.
Normally a higher return on net assets ratio will be desirable. Although a trend or industry-standard comparison can provide a better picture. The important point with a ratio analysis is to identify the trends. The analyst must also take into account the one-off events that change these figures. In our example, Walmart increased sales are seasonal, which are likely to fall back to normal in the coming years.
The Return on Net Assets ratio analysis can also be used effectively with one-time projects. In that case, the company should use the profits arising from the project and assets employed for the project only.
For effectiveness purposes, the analysts may also adjust the depreciation charge for the fixed assets to reveal more effective and realistic figures.
Limitations of the Return on Net Assets Ratio
The foremost disadvantage with any financial ratio analysis is that ratios cannot provide comprehensive analysis on a standalone basis. The Return on Net Assets figure uses three components, which all rely heavily on accounting standards and company policies. These figures can be manipulated. For example, the fixed assets can be changed significantly with a depreciation charge. Similarly, the net working capital figures can be altered with adjustments in accounts receivables and payables.
Conclusion
The Return on Net Asset ratio provides useful information on the efficiency of long-term assets of a company. It provides insights on the effective utilization of net assets and returns generated from these net assets. However, the comparison must be carefully made with historical performance and industry standards. The one-off large impacts such as large depreciation charges or seasonal sales can be written-off to create a realistic analysis.