In this article, we will cover in detail about the financial analysis techniques or tools in order to analyse financial statements. This ultimate guides of the financial analysis techniques will provide you an insights how to use various techniques or tools in performing the financial analysis of financial statements of a company.
Reading financial statements is not just a simple thing. It requires skill how to read them and applying certain techniques or tools in order to analyze those statements. Therefore, what are those tools or techniques in Financial Statements Analysis?
Before going in detail about those techniques or tools, let’s understand some basic definition of Financial Statement Analysis, the need or important of Financial Statements Analysis as well as the purpose of such analysis.
Definition
Financial Statements Analysis or sometimes called Financial Analysis involves the process of applying analytical tools or techniques on the financial statements as well as other related data such as disclosure notes to financial statements in order to make any business decision. In other word, financial statement analysis refers to the way how to read financial statements to get the insights which are very important for any investments or financing arrangements.
Typically, we do the analysis on income statement, balance sheet, statement of retained earnings, and statement of cash flow as well as the disclosure notes in the financial statements. In order to analyze financial statements, it involves using various techniques or tools and all of these techniques or tools will be covered in detail in the later section below.
Purpose of Financial Statement Analysis
There are two key stakeholder groups that are interested in financial statements analysis. These are internal and external stakeholders.
The purpose of financial analysis for internal stakeholders is to provide them the necessary strategic financial information for business decision making as well as to improve the company efficiency and effectiveness for the provision of product and services. Internal stakeholders refers to all level of managements, officers, internal auditors, consultants and other staff.
On the other hand, the purpose of financial analysis for external stakeholders is to provide them the necessary financial information in order for them to make better and more informed decisions in pursuing their own goals. These external stakeholders are not directly involved in the running or operation of the company. Those stakeholders are shareholders, lenders, customers, suppliers or creditors, regulators, lawyers, brokers and other stakeholders outside the company.
For shareholders and lenders, they need financial statements and its analysis in order to make any future investment or lending prospect. Customers analyze financial statements in order to assess if they need to establish a supplier relationship with the company. Suppliers or creditors need financial analysis in order to assess and determine the credit terms if they engage to provide product or service to the company. Regulators, for example tax authority, needs financial statements and its analysis in order assess the tax that the company need to pay to the tax authority.
Building Blocks of Financial Analysis
Typically, there are four building block for the financial statements analysis and this analysis focuses on one or more elements of the financial condition or performance of a company.
As financial analysts, they shall need to select the building block of financial statement analysis to which it best relates to their business environment. However, they should over focus on only one building block. This is because, when we over focus on only one building block, we would have missed the other aspects that are very important. Thus, as a financial analyst, he or she shall need to maintain the balance between those four building block for the analysis of financial statements.
Below are the four building blocks of financial statement analysis:
- Liquidity and efficiency: This building block refers to the ability to meet short-term obligations and the efficiency of generate revenues for a company.
- Solvency: This refers to the ability to meet long-term obligations; commonly for bank loan and other long-term liabilities.
- Profitability: This refers to how the profitable the company is? And this is very important to enable the company to provide any financial rewards sufficiently to attract and retain any financing arrangements.
- Market prospect: This involves the ability to show or indicate the positive market expectation from the users of financial statements.
Important Information for Financial Analysis
The stakeholders need general purpose financial statements in order to perform their analysis. The general purpose financial statements refers to all types of financial statements as follow:
- Income Statement
- Balance Sheet
- Statement of Changes in Equity or Statement of Stockholders’ Equity or Statement of Retained Earnings;
- Statement of Cash Flow and;
- Notes to financial statements.
All these components form part of the general purpose financial statements.
In addition to the general purpose of financial statements, in order to have complete information for their analysis, all those stakeholders also need Financial Reporting. Financial Reporting here refers to all kinds of communication of financial information which is useful for their decision making. They need not only general purpose financial statements but also other information such as below:
- All relevant information from Stock Exchange Commission (SEC), where applicable;
- Other related information of filings;
- Press Releases;
- Shareholders’ meetings;
- Forecasts;
- Management Letters;
- Auditors’ reports and;
- Any Webcast where applicable
All the above information are crucial for their analysis.
Now, we have covered all necessary information in order to provide the reader of financial statement to be able for their analysis. Therefore, let’s jump in to the detail analytical tools or techniques that are necessary to perform the analysis of financial statements.
Financial Statement Analysis Tools or Techniques
Financial Statement Analysis Tools are sometimes called Financial Statement Analysis Techniques. There are 3 main tools that we can use to analyze financial statements and those tools are divided into several other methods. These are as follow:
- Horizontal Analysis: This is also called Comparative Statements. This analysis includes the comparison of an entity’s financial statements over time periods.
- Vertical Analysis: This is also called Common Size Financial Statements This analysis includes comparison of an entity’s financial statements against any based amount.
- Financial Ratios Analysis: This is also called Accounting Ratios Analysis.
In the later section below, we cover in detail of each of the financial analysis tools with examples.
Let’s dive in:
1. Horizontal Analysis or Comparative Statements
How to do horizontal analysis of financial statements?
As mentioned above, horizontal analysis is also known as comparative analysis of financial statements. It is one of the financial analysis techniques or tools what we use to analyze financial statements. In the Horizontal Analysis, we normally do the comparison of financial statements over time period. The word horizontal analysis arises from the analysis that compare from left to right or from the right to left movement of financial data when we perform the review of comparative financial statements over time periods.
So what is comparative financial statements?
The comparative financial statements is one type of the financial analysis techniques that we prepare in multiple periods. The purpose of preparing the comparative financial statements to enable the user to compare the financial performance or financial position from year to year or from period to period.
The comparative financial statements are commonly prepared in both changes of value term and percentage.
So how to compute the changes in value or percentage?
In horizontal analysis, we compute the percent change by subtracting the base period amount from the analysis period amount and then divide it with base period amount. While the changes in value is just subtracting the base period amount from the analysis period amount.
The formula is then summarized below:
Dollar Amount Change = Amount of Analysis Period – Amount of Base Period
Percentage Change (%) = (Amount of Analysis Period – Amount of Base Period)/Amount of Base Period × 100
Typically, the horizontal analysis of comparative financial statements includes both comparative balance sheet and comparative income statement. In addition, trend analysis is also categorized under horizontal analysis.
Comparative Balance Sheet
In comparative balance sheet, it consists of balance sheet amounts from two or more periods prepared comparatively side by side. In this technique of financial analysis, it is typically useful to prepare the comparative balance sheet to include the changes in both value term and percentage. By doing so, it is easy for the user or reader of financial statements to compare the performance over time periods.
Commonly, in the comparative balance sheet analysis, the user look at the big changes in value term and percentage and then dig down or investigate to the real consequent of such big changes.
Below is the example of the horizontal comparative balance sheet:
| ABC Co | ||||
| Comparative Balance Sheet | ||||
| For the Year Ended 31 December 20X9 | ||||
| 20X9 | 20X8 | Dollar | Percent | |
| US$ ‘000 | US$ ‘000 | Change | Change | |
| Assets | ||||
| Current Assets | ||||
| Cash and cash equivalents | 35,200 | 25,300 | 9,900 | 39.1% |
| Short-term investments | 23,800 | 16,500 | 7,300 | 44.2% |
| Accounts receivable, net | 35,000 | 26,000 | 9,000 | 34.6% |
| Inventories | 25,500 | 17,500 | 8,000 | 45.7% |
| Prepaid expenses | 4,500 | 3,200 | 1,300 | 40.6% |
| Other current assets | 24,300 | 20,100 | 4,200 | 20.9% |
| Total current assets | 148,300 | 108,600 | 39,700 | 36.6% |
| Non-current assets | ||||
| Property and equipment, net | 205,500 | 115,200 | 90,300 | 78.4% |
| Long-term investments | 5,200 | 13,500 | (8,300) | -61.5% |
| Intangible assets | 50,100 | 16,300 | 33,800 | 207.4% |
| Other long-term assets | 15,300 | 13,600 | 1,700 | 12.5% |
| Total non-current assets | 276,100 | 158,600 | 117,500 | 74.1% |
| Total assets | 424,400 | 267,200 | 157,200 | 58.8% |
| Liabilities | ||||
| Current liabilities | ||||
| Account payable | 15,500 | 14,300 | 1,200 | 8.4% |
| Accrued expenses | 22,500 | 28,100 | (5,600) | -19.9% |
| Current portion of long-term debt | 3,200 | 1,000 | 2,200 | 220.0% |
| Other current liabilities | 22,600 | 13,800 | 8,800 | 63.8% |
| Total current liabilities | 63,800 | 57,200 | 6,600 | 11.5% |
| Non-current liabilities | ||||
| Long-term debt, net of current portion | 50,900 | 4,600 | 46,300 | 1006.5% |
| Other long-term liabilities | 24,500 | 9,400 | 15,100 | 160.6% |
| Total non-current liabilities | 75,400 | 14,000 | 61,400 | 438.6% |
| Total liabilities | 139,200 | 71,200 | 68,000 | 95.5% |
| Shareholders’ Equity | ||||
| Common stock | 180,500 | 125,600 | 54,900 | 43.7% |
| Accumulated other comprehensive income (loss) | (1,500) | 520 | (2,020) | -388.5% |
| Retained earnings | 102,403 | 68,925 | 33,478 | 48.6% |
| Other equity | 3,797 | 955 | 2,842 | 297.6% |
| Total shareholders’ equity | 285,200 | 196,000 | 89,200 | 45.5% |
| Total liabilities and shareholders’ equity | 424,400 | 267,200 | 157,200 | 58.8% |
From the comparative balance sheet above, we notice few items have stand out. As you can see, almost asset elements substantially increase. This indicates that ABC Co is at growth stage. There are substantial increase in property and equipment as well as intangible assets which account for 78.4% and 207.4% respectively and these substantial increase came from the financing activities. As you can see, there are also substantial increase in long-term debt (both current and non-current portion) and common stockholders’ equity.
This indicates that ABC Co is using growth strategy by obtaining fund from both loan and stock to finance its investment on assets. This results in the total substantial increase in assets of 58.8%.
Comparative Income Statement
The same as comparative balance sheet, the comparative income statement is prepared for two or more accounting periods comparatively year by year in both value term and percentage.
In the horizontal comparative income statement, the techniques for financial analysis is that the reader of financial statements is interested in looking at the changes or increase/decrease of revenues and expenses of an entity. Below is the example of horizontal comparative income statement:
| ABC Co | ||||
| Comparative Income Statement | ||||
| For the Year Ended 31 December 20X9 | ||||
| 20X9 | 20X8 | Dollar | Percent | |
| US$ ‘000 | US$ ’000 | Change | Change | |
| Total revenues | 520,500 | 430,500 | 90,000 | 20.9% |
| Cost of sales | 402,388 | 344,132 | 58,256 | 16.9% |
| General and administrative expenses | 30,200 | 28,700 | 1,500 | 5.2% |
| Depreciation and amortization expenses | 14,200 | 9,100 | 5,100 | 56.0% |
| Other expenses | 9,700 | 3,500 | 6,200 | 100.0% |
| Other losses | 5,200 | 2,200 | 3,000 | 136.4% |
| Loss on sales of property and equipment | 1,500 | 890 | 610 | 68.5% |
| Profit before interest and taxes | 57,312 | 41,978 | 15,334 | 36.5% |
| Interest income | 1,966 | 2,980 | (1,014) | -34.0% |
| Interest expense | 2,300 | 780 | 1,520 | 194.9% |
| Profit before income taxes | 56,978 | 44,178 | 12,800 | 29.0% |
| Income taxes | 23,500 | 17,800 | 5,700 | 32.0% |
| Net Income | 33,478 | 26,378 | 7,100 | 26.9% |
From the comparative income statement above, ABC Co has a substantial revenue growth of 20.9% while they can manage cost effectively. ABC Co is able to manage its cost of sales as well as the general and administrative expenses at 16.9% and 5.2% respectively. Ultimately, there is a substantial net profit growth of 26.9%.
This indicates that ABC Co is at growth stages. While there is an aggressive revenue growth strategy, it can also maintain a lower increase in costs.
Trend Analysis
Similar to comparative balance sheet and comparative income statement, trend analysis involves more than one period. Basically, it is one of the financial analysis techniques that includes more periods than normal comparative balance sheet and income statement. That is why we call trend analysis. Another difference from the comparative financial statements is the way how we calculate the percentage. In this technique of financial analysis, we do not subtract the base period amount in the numerator in order to calculate the percentage. Instead, we divide the analysis period amount with base period amount straight away.
Below is the formula to calculate percentage in trend analysis:
Trend Percent (%) = (Analysis amount/Base amount) × 100
In order to illustrate the trend analysis, let’s use the 5 years of main elements in the income statement of ABC Co as below:
| 20X5 | 20X6 | 20X7 | 20X8 | 20X9 | |
| US$ | US$ | US$ | US$ | US$ | |
| ‘000 | ‘000 | ‘000 | ‘000 | ‘000 | |
| Total revenues | 190,500 | 225,000 | 320,000 | 430,500 | 520,500 |
| Cost of sales | 162,300 | 200,500 | 255,200 | 344,132 | 402,388 |
| General and administrative expenses | 11,600 | 15,300 | 21,500 | 28,700 | 30,200 |
In this trend analysis, we will use 20×5 as the base year. Thus, in calculating the percentage, we will divide each amount of revenue and expenses against the base year which is 20×5.
Thus, based on the selected accounts of the income statement above, we can prepare the trend analysis in percentage as below:
| 20X5 | 20X6 | 20X7 | 20X8 | 20X9 | |
| Total revenues | 100.0% | 118.1% | 168.0% | 226.0% | 273.2% |
| Cost of sales | 100.0% | 123.5% | 157.2% | 212.0% | 247.9% |
| General and administrative expenses | 100.0% | 131.9% | 185.3% | 247.4% | 260.3% |
We can also present it in graph as below showing the trend line of each revenue and expense account:
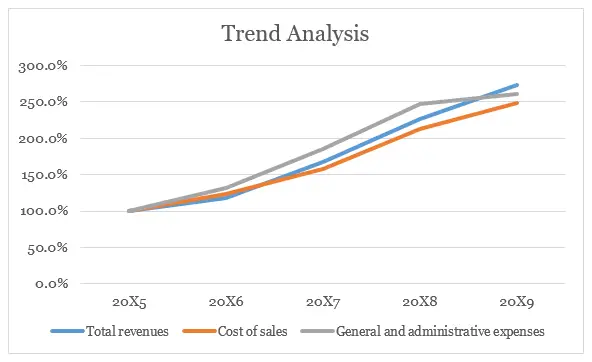
As you can see from the trend table and graph, ABC Co has a constant growth of both revenue and expenses. This is because ABC Co now is a high growth company.
The trend line of general and administrative expenses is above the revenue line for most of the year except the last year (20×9). This is a good news that ABC Co can prove management that finally after consistently increasing trend of the general and administrative expenses exceeding the revenue trend, now they can manage the trend of expenses lower than the revenue.
2. Vertical Analysis
How to do vertical analysis of financial statements?
Vertical analysis is a financial analysis technique that we use to evaluate individual financial statements items or group of items against a specific base amount.
In this technique of financial analysis, we typically divide each items or group of items of balance sheet with total assets and each items or group of items of the income statement with total revenue.
Vertical analysis is also known as the common-size statements. As mentioned above, in the common size statements, we divide each individual financial statement line items or group of items with the base amount. The vertical analysis formula for both balance sheet and income statement is as follow:
Common size percentage (%) = (Analysis amount/Base amount) × 100
In the vertical analysis, the common size statements can be used to analyze both balance sheet and income statement.
Common Size Balance Sheet
As mentioned above, in the common size balance sheet, we commonly divide each individual balance sheet items or group of items with total assets. Below is the example of the common size balance sheet:
| ABC Co | ||||
| Common Size Balance Sheet | ||||
| For the Year Ended 31 December 20X9 | ||||
| Common Size | Common Size | |||
| 20X9 | 20X8 | 20X9 | 20X8 | |
| US$ ‘000 | US$ ‘000 | % | % | |
| Assets | ||||
| Current Assets | ||||
| Cash and cash equivalents | 35,200 | 25,300 | 8.3% | 9.5% |
| Short-term investments | 23,800 | 16,500 | 5.6% | 6.2% |
| Accounts receivable, net | 35,000 | 26,000 | 8.2% | 9.7% |
| Inventories | 25,500 | 17,500 | 6.0% | 6.5% |
| Prepaid expenses | 4,500 | 3,200 | 1.1% | 1.2% |
| Other current assets | 24,300 | 20,100 | 5.7% | 7.5% |
| Total current assets | 148,300 | 108,600 | 34.9% | 40.6% |
| Non-current assets | ||||
| Property and equipment, net | 205,500 | 115,200 | 48.4% | 43.1% |
| Long-term investments | 5,200 | 13,500 | 1.2% | 5.1% |
| Intangible assets | 50,100 | 16,300 | 11.8% | 6.1% |
| Other long-term assets | 15,300 | 13,600 | 3.6% | 5.1% |
| Total non-current assets | 276,100 | 158,600 | 65.1% | 59.4% |
| Total assets | 424,400 | 267,200 | 100.0% | 100.0% |
| Liabilities | ||||
| Current liabilities | ||||
| Account payable | 15,500 | 14,300 | 3.7% | 5.4% |
| Accrued expenses | 22,500 | 28,100 | 5.3% | 10.5% |
| Current portion of long-term debt | 3,200 | 1,000 | 0.8% | 0.4% |
| Other current liabilities | 22,600 | 13,800 | 5.3% | 5.2% |
| Total current liabilities | 63,800 | 57,200 | 15.0% | 21.4% |
| Non-current liabilities | ||||
| Long-term debt, net of current portion | 50,900 | 4,600 | 12.0% | 1.7% |
| Other long-term liabilities | 24,500 | 9,400 | 5.8% | 3.5% |
| Total non-current liabilities | 75,400 | 14,000 | 17.8% | 5.2% |
| Total liabilities | 139,200 | 71,200 | 32.8% | 26.6% |
| Shareholders’ Equity | ||||
| Common stock | 180,500 | 125,600 | 42.5% | 47.0% |
| Accumulated other comprehensive income (loss) | (1,500) | 520 | -0.4% | 0.2% |
| Retained earnings | 102,403 | 68,925 | 24.1% | 25.8% |
| Other equity | 3,797 | 955 | 0.9% | 0.4% |
| Total shareholders’ equity | 285,200 | 196,000 | 67.2% | 73.4% |
| Total liabilities and shareholders’ equity | 424,400 | 267,200 | 100.0% | 100.0% |
From the comparative common size balance above, we notice some increase and decrease that stand out as follow:
(1). Accounts receivable decreased from 9.7% to 8.2%
(2). Property and equipment increased from 43.1% to 48.4%
(3). Intangible assets increased from 6.1% to 11.8%
(4). Accrued expenses decreased from 10.5% to 5.3%
(5). Long-term debts increased from 1.7% to 12%
These changes indicate that ABC Co is a successful growth company. The only concern is whether this company is able to generate sufficient revenues in order to support its assets buildup as well as the increase in financing facility.
Common Size Income Statement
Similar to common size balance sheet, in the common size income statement, we commonly divide each individual income statement items or group of items with total revenue. Below is the example of the common size income statement:
| ABC Co | ||||
| Common Size Income Statement | ||||
| For the Year Ended 31 December 20X9 | ||||
| Common Size | Common Size | |||
| 20X9 | 20X8 | 20X9 | 20X8 | |
| US$ ‘000 | US$ ‘000 | % | % | |
| Total revenues | 520,500 | 430,500 | 100.0% | 100.0% |
| Cost of sales | 402,388 | 344,132 | 77.3% | 79.9% |
| General and administrative expenses | 30,200 | 28,700 | 5.8% | 6.7% |
| Depreciation and amortization expenses | 14,200 | 9,100 | 2.7% | 2.1% |
| Other expenses | 9,700 | 3,500 | 1.9% | 0.8% |
| Other losses | 5,200 | 2,200 | 1.0% | 0.5% |
| Loss on sales of property and equipment | 1,500 | 890 | 0.3% | 0.2% |
| Profit before interest and taxes | 57,312 | 41,978 | 11.0% | 9.8% |
| Interest income | 1,966 | 2,980 | 0.4% | 0.7% |
| Interest expense | 2,300 | 780 | 0.4% | 0.2% |
| Profit before income taxes | 56,978 | 44,178 | 10.9% | 10.3% |
| Income taxes | 23,500 | 17,800 | 4.5% | 4.1% |
| Net Income | 33,478 | 26,378 | 6.4% | 6.1% |
From the comparative common size income statement above, we notice that the cost of sales decreased from 79.9% to 77.3%. In addition, general and administrative expenses also decreased from 6.7% to 5.8%. This indicates that the management of ABC Co has effectively controlled costs while the company is reaping growth benefits which is commonly called economies of scale.
In contrast, the depreciation and amortization expenses as well as interest expense increased from 2.1% to 2.7% and from 0.2% to 0.4% respectively. This is because the company has borrowing more fund to finance its investment on assets both property and equipment and intangible assets. This typically implies that the company is at growth stage. Commonly, if a company is growing, they need to invest more capital thus increase assets in order to utilize it to generate revenue.
3. Financial Ratios Analysis
Financial ratios are widely used for financial analysis. They are the popular financial analysis techniques or tools as they provide both in value, percentage or proportion between two or more numbers. Financial ratio can help to uncover conditions or trends to enable the reader to detect by inspecting each individual component for each ratio.
In this technique of financial analysis, financial ratio commonly expresses as a mathematical relationship between two or more quantities. As mentioned above, it can be expresses as a percentage, rate or proportion. For example, the growth rate is calculated by subtracting the base amount from analysis amount and then divide with base amount. This would provide the growth as a rate or percentage.
Financial ratio computation is simple and straightforward as we use simple arithmetic operation; however, the interpretation might not be simple. The meaningful interpretation and analysis depends on the capability of the reader or financial analyst.
In this section, we will describe the important set of each financial ratio and its application as well as how to interpret each ratio. In analyzing the financial statements, the financial analyst shall need to select the building block of financial statement analysis to which it best relates in accordance with the nature of business operation of each company.
There are typically four building block of financial statement analysis. These are (1) Liquidity and Efficiency, (2) Solvency, (3) profitability and (4) market prospect. Different building block provide different information for each component of the financial ratios.
Please note that in the section below, for any ratios that are required to calculate the average of balance sheet items, we will illustrate the analysis only one year which is 20X9. This is because we do not have the opening balance brought down from 20X7.
Liquidity and Efficiency Ratios
The Liquidity and efficiency ratios is the first building block of financial statement analysis. Liquidity provides the information on the availability of a company’s resources to meet short-term obligation or cash requirement. It is typically affected by the timing of cash inflows and cash outflows.
Efficiency, on the other hand, provides the information on how productive a company is in utilizing its assets. The efficiency ratios are commonly measured the relationship between the utilization of assets against the revenues. This means that these ratios are interested to indicate how the assets can generate revenues for a company. Efficiency ratios are commonly called asset utilization ratios.
Thus, in this building block of financial statement analysis, we can divide it into two sub categories. These are liquidity ratios and efficiency ratios or assets utilization. In these financial analysis techniques, it involves using various financial ratios in relation to the liquidity an efficiency position of a company as follow:
So let’s go one by one of the liquidity and efficiency ratios.
(1). Current Ratio
The first type of liquidity ratio is current ratio. It measures the short-term debt paying ability of an entity. This ratio is computed by dividing the current assets with current liabilities.
The current ratio formula is as follow:
Current ratio = Current assets/Current liabilities
Taking the information from ABC Co above, we can compute the current ratio as below:
| 20X9 | 20X8 | |
| US$’000 | US$’000 | |
| Current Assets (A) | 148,300 | 108,600 |
| Current Liabilities (B) | 63,800 | 57,200 |
| Current Ratio (A/B) | 2.32 times | 1.90 times |
The current ratio for ABC Co is 2.32 times and 1.9 times respectively. This indicates that ABC Co is at strong liquidity position and has the ability to use it current assets to cover its current liabilities.
Look at the ratio for the company alone does not give a good indicator. The company should compare the ratio with the relevant industry average to have better judgment on its current level of ratio.
T00 high level of current ratio does not mean it is good and it indicates that the company does not utilize its assets efficiently. This is because normally, current assets generate a low level of return on investment as compare to long term assets. Thus, a business shall maintain its current ratio at the appropriate level to ensure that it meets short-term obligation while use the excessive amount to generate more revenue for the company.
(2). Acid-Test Ratio or Quick Ratio
Another types of liquidity ratios is Acid-Test Ratio. The Acid-Test Ratio is commonly called Quick Ratio. This ratio measures the immediate short-term debt paying ability. It is similar to current ratio except the exclusion of inventory from the numerator. To compute the Acid-Test Ratio, we take out the inventory from the current assets before we divide with current liabilities.
The Acid-Test Ratio can be calculated by using the formula as below:
Acid-Test Ratio or Quick Ratio= (Total Current Assets – Inventory)/Total Current Liabilities
In some other calculation, the numerator which is the quick assets consist only cash and cash equivalents, short term investment or marketable securities and accounts receivable.
In our example, we will take the current assets minus inventory as the numerator.
Taking the extract data of the ABC Co in the previous section above, we can calculate the Acid-Test Ratio as follow:
| 20X9 | 20X8 | |
| US$’000 | US$’000 | |
| Current Assets (A) | 148,300 | 108,600 |
| Inventory (B) | 25,500 | 17,500 |
| Quick Assets (C = A – B) | 122,800 | 91,100 |
| Current Liabilities | 63,800 | 57,200 |
| Acid-Test Ratio | 1.92 times | 1.59 times |
From the calculation above, the Acid-Test Ratio of ABC Co are 1.92 times and 1.59 times for 20X9 and 20X8 respectively. This indicates that even though we take out inventory, the company still has a strong liquidity position to meet current or short-term obligation.
The same as current ratio, the company should look at the relevant industry average to see how the current level of Acid-Test Ratio if we compare to the industry average.
(3). Accounts Receivable Turnover
Accounts Receivable Turnover is another type of liquidity and efficiency ratio. This ratio measures the efficiency of collection of a company’s accounts receivable. To compute this ratio, we take the total net sales divided by average accounts receivable. Typically, to be more precise, the credit sales shall be used instead of net sales. However, in practice, the credit sales are not normally presented. Therefore, so far, we commonly take net sales as the numerator to calculate the accounts receivable turnover.
The accounts receivable turnover is calculated as per the formula below:
Accounts Receivable Turnover = Net Sales/ Accounts Receivable in Average
Where: Average Accounts Receivable = (Opening Receivables + Closing Receivables)/2
Using the data from the ABC Co, we can compute the accounts receivable turnover as below:
| 20X9 | |
| US$’000 | |
| Net Sales (A) | 520,500 |
| Opening Accounts Receivable (B) | 26,000 |
| Closing Accounts Receivable (C) | 35,000 |
| Average Accounts Receivable [D = (B+C)/2] | 30500 |
| Accounts Receivable Turnover (E = A/D) | 17.07 times |
From the calculation above, ABC Co has accounts receivable turnover of 17.07 times. Basically, the higher the turnover, the better the company is. However, if the accounts receivable turnover is too high, it might indicate that the company has used very restrictive policy or credit term and this in the future might negatively affect the sales volume.
To be more precise, ABC Co should also obtain the relevant industry average data and then compare its turnover to such industry data.
(4). Inventory Turnover
The fourth liquidity and efficiency ratios is inventory turnover. It measures the efficiency of inventory management of a company. Basically, the period of holding inventory will affect the working capital requirement. Thus, the longer the inventory turnover, the worse it will affect the working capital requirement.
To compute the inventory turnover, we take the cost of goods sold or cost of sales divided by average inventory.
The formula of inventory turnover is then summarized as follow:
Inventory Turnover = Cost of Sales/Average Inventory
Where: Average Inventory = (Opening Inventory + Closing Inventory)/2
Taking the data from ABC Co above, we can calculate the inventory turnover as below:
| 20X9 | |
| US$’000 | |
| Cost of Sales (A) | 402,388 |
| Opening Inventory (B) | 17,500 |
| Closing Inventory (C) | 25,500 |
| Average Inventory [D = (B+C)/2] | 21,500 |
| Inventory Turnover (E = A/D) | 18.72 times |
From the calculation above, the inventory turnover of ABC Co is 18.72 times. This indicates that ABC Co take a bit long to convert into sales.
In order to have a precise analysis of this, ABC Co shall need to compare to the relevant industry average.
(5). Days Sales Outstanding (DSO) or Day’s Sales Uncollected
The Days Sales Outstanding (DSO) is also commonly known as Average Daily Sales Outstanding or Day’s Sales Uncollected. It is another ratio under the liquidity and efficiency building block of financial statement analysis. It measures liquidity of receivables to how many days a company can collect its accounts receivable. The less number of days the better the company is in collecting its accounts receivable.
The DSO is calculated by dividing the accounts receivable with net sales and multiply with 365 days.
The formula of DSO is summarized as follow:
DSO = (Accounts Receivable/Net Sales) × 365
The DSO of ABC Co is calculated as follow:
| 20X9 | 20X8 | |
| US$’000 | US$’000 | |
| Accounts Receivable (A) | 35,000 | 26,000 |
| Net Sales (B) | 520,500 | 430,500 |
| DSO [D = (A/B) × 365] | 24.54 days | 22.04 days |
The DSO of ABC Co is 24.54 days and 22.04 days for 20X9 and 20X8 respectively. This indicates that ABC Co is able to collect its accounts receivable quickly. Commonly, the credit period of accounts receivable is 30 days. Thus, ABC Co has collected its accounts receivable more quickly than the allowable credit term.
However, this figure only cannot be said as good. ABC Co needs to take the relevant industry average to compare to have a precise analysis.
(6). Days’ Sales in Inventory
Days’ Sales in Inventory is another type of liquidity and efficiency ratios. This ratio measures the liquidity of inventory. Days’ sales in inventory is also known as days’ stock on hand. It analyzes how much inventory is available in term of the number of days’ sales.
The days’ sales in inventory can also be analyzed as number of days that a company can sell its inventory if there is no items are restocked or purchased. In addition, it is also commonly interpreted as a measure of inventory buffer against stock-out. Therefore, it is very useful to perform the evaluation of liquidity of inventory.
The days’ sales in inventory is computed by dividing the closing inventory with cost of sales and then multiply with 365 days.
The days’ sales in inventory formula is as follow:
Days’ Sales in Inventory = (Closing Inventory/Cost of Goods Sold) × 365
By using the financial data of ABC Co above, we can calculate the Days’ Sales in Inventory as follow:
| 20X9 | 20X8 | |
| US$’000 | US$’000 | |
| Closing Inventory (A) | 25,500 | 17,500 |
| Cost of Sales (B) | 402,388 | 344,132 |
| Days’ Sales in Inventory [D = (A/B) × 365] | 23.13 days | 18.56 days |
From the calculation above, the days’ sales in inventory is 23.13 days and 18.56 days for 20X9 and 20X8 respectively. This indicates that ABC Co is carrying 23.13 days for 20X9 and 18.56 days for 20X8 of sales in inventory.
(7). Total Asset Turnover
Total Asset Turnover is the last ratio under liquidity and efficiency building block of financial statement analysis. It measures the efficiency of assets in generating sales. This is an important indication of operating efficiency; the way how efficiently a company uses its assets to generate revenues.
The total assets turnover ratio is calculated by dividing the net sales against the average total assets.
The total assets turnover ratio formula is as follow:
Total Assets Turnover = Net Sales/Average Assets in Total
Where: Average Total Assets = (Opening Total Assets + Closing Total Assets)/2
Again, as per the financial data of ABC Co above, we can calculate the total assets turnover as follow:
| 20X9 | |
| US$’000 | |
| Net Sales (A) | 520,500 |
| Opening Total Assets (B) | 267,200 |
| Closing Total Assets (C) | 424,400 |
| Average Total Assets [D = (B+C)/2] | 345,800 |
| Total Assets Turnover (E = A/D) | 1.51 times |
The total assets turnover of ABC Co is 1.51 times. This indicates that ABC Co can generate sales of 1.51 times of its total assets.
To be more precise, we need to look at the trend of this ratio as well as the industry average data.
Solvency Ratios
The second building block of financial statement analysis is solvency ratios. Solvency ratios measure a company’s long-term financial viability and its ability to cover long-term liabilities or obligations. In this building block, it involves using various financial analysis techniques or ratios in relation to the solvency of a company.
In solvency ratios analysis, capital structure is one of the most important components. Basically, capital structure refers to the sources of finance of a company. These includes both equity and debt financing. In this section, we will cover four main solvency ratios namely debt ratio, equity ratio, pledged assets to secured liabilities and time interest earned ratio.
(1). Debt Ratio
Debt ratio is also commonly called debt to total asset. It measures the portion of a company’s assets that are contributed by creditors or debtors. This ratio expresses the total liabilities as a percentage to total assets.
The debt ratio can be calculated by using the below formula:
Debt Ratio = (Total Debt/Total Assets) ×100
Based on the balance sheet of ABC Co above, the debt ratio can be calculated as follow:
| 20X9 | 20X8 | |
| US$’000 | US$’000 | |
| Total Debt (A) | 139,200 | 71,200 |
| Total Assets (B) | 424,400 | 267,200 |
| Debt Ratio [C = (A/B) × 100] | 32.80% | 26.65% |
The debt ratio of ABC Co is 32.80% and 26.65% for 20X9 and 20X8 respectively. This indicates that ABC Co.’s source of fund is 32.80% for 20X9 and 26.65% for 20X8 from debt. The debt ratio increased in 20X9 is because the additional long-term debt ABC Co obtained in 20X9.
(2). Equity Ratio
Similar to debt ratio, equity ratio measures the portion of a company’s assets that are contributed by equity holders or shareholders. This ratio expresses the total equity as a percentage to total assets.
The equity ratio can be calculated by using the below formula:
Equity Ratio = (Total Equity/Total Assets) ×100
Based on the balance sheet of ABC Co above, the equity ratio can be calculated as follow:
| 20X9 | 20X8 | |
| US$’000 | US$’000 | |
| Total Equity (A) | 285,200 | 196,000 |
| Total Assets (B) | 424,400 | 267,200 |
| Equity Ratio [C = (A/B) × 100] | 67.20% | 73.35% |
The equity ratio of ABC Co is 67.20% and 73.35% for 20X9 and 20X8 respectively. This indicates that ABC Co.’s source of fund majority came from equity holders.
(3). Pledged Assets to Secured Liabilities
The pledged asset to secured liabilities is another solvency ratio that is used to evaluate the risk of nonpayment faced by secured creditors. This ratio is calculated by dividing the book value of pledged assets with the book value of secured liabilities.
So in this case, what does secured liability mean?
The secured liabilities refer to the liabilities or debts that a company uses assets as a collateral. This asset is commonly called pledged asset.
The pledged asset to secured liabilities ratio can be calculated by using the below formula:
Pledged Assets to Secured Liabilities Ratio = Book Value of Pledged Assets/Book Value of Secured Liabilities
In practice, this ratio is rarely used. This is because normally, the value of pledged assets were not disclosed or reported in the financial statements.
Typically, the person who can obtain this information from the company is the bankers or lenders. Before they grand a loan facility, they will enquire about the asset to be pledged. They use this ratio to assess the ability of recovering the debt if it is become default.
This ratio is generally considered as good at 2:1. That means, the pledged assets need to be twice higher than the secured liabilities.
(4). Times Interest Earned Ratio
The last solvency ratio is times interest earned ratio. This is sometimes called interest covered ratio. This ratio evaluate how much a company has its profit before interest and tax to cover its interest expense.
Times interest earned ratio indicates the risk of the creditors of non-repayment of loan and interest from the debtors.
This ratio is calculated by dividing the profit before interest and tax (PBIT) with interest expense.
Thus, the times interest earned ratio formula can be written as below:
Time Interest Earned Ratio = PBIT/Interest Expense
From the financial data of ABC Co above, we can calculate the times interest earned ratio as follow:
| 20X9 | 20X8 | |
| US$’000 | US$’000 | |
| PBIT (A) * | 57,312 | 41,978 |
| Interest Income (B) | 1,966 | 2,980 |
| Adjusted PBIT (C = A+B) | 59,278 | 44,958 |
| Interest Expense (D) | 2,300 | 780 |
| Times Interest Earned Ratio (E = C/D) | 25.77 times | 57.64 times |
*PBIT above excluded the interest income. Thus, we need to add back the interest income.
From the calculation above, the times interest earned ratio of ABC Co is 25.77 times and 57.64 times for 20X9 and 20X8 respectively. The decrease of times interest earned ratio in 20X9 is because of the increase in interest expense as result of additional long-term debt in 20X9. This indicates that ABC Co has its PBIT of 25.77 times and 57.64 times of its interest expense for 20X9 and 20X8 respectively. That means ABC Co has a very good profit to cover its interest expense even though there is a big drop in times interest earned ratio in 20X9.
Profitability Ratios
Another building block of financial statement analysis is profitability ratios. In this building block, we focus on the profitability of a business. There are number of ratios that we can use as financial analysis techniques in this building block. Thus, we will go detail one by one as below.
(1). Profit Margin
Profit margin is one of the profitability ratios that measures the ability to earn net income from sales. This ratio expresses as percentage of net income over sales.
Below is the profit margin formula:
Profit Margin = Net Income/Net Sales
Based on the financial data of ABC Co above, we can calculate the profit margin of the company as follow:
| 20X9 | 20X8 | |
| US$’000 | US$’000 | |
| Net Income (A) * | 33,478 | 26,378 |
| Net Sales (B) | 520,500 | 430,500 |
| Profit Margin (C = A/B) | 6.43% | 6.13% |
* We can also use the profit before interest and tax (PBIT) instead of net income to calculate the profit margin.
From the calculation above, the profit margin of ABC Co slightly increase from 6.13% to 6.43% for 20X8 and 20X9 respectively.
In order to interpret whether this ratio is good or bad, we shall need to compare as trend as well as to the industry average.
Let’s assume that, the profit margin for the relevant industry of ABC Co is from 10% to 15%.
Thus, in this case, ABC Co has lower profit margin as compare to industry average.
(2). Return on Assets (ROA)
Return on assets is one of the profitability ratio that measures how much net income a company generated compare to total assets. We can calculate the return on assets by dividing the net income with average total assets.
Below is the return on assets formula:
Return on Assets (ROA) = Net Income/Total Assets in Average
From the financial data of ABC Co above, we can calculate the return on assets of the company as follow:
| 20X9 | |
| US$’000 | |
| Net Income (A) * | 33,478 |
| Opening Total Assets (B) | 267,200 |
| Closing Total Assets (C) | 424,400 |
| Average Total Assets [D = (B+C)/2] | 345,800 |
| Return on Assets (E = A/D) | 9.68% |
* We can also use the profit before interest and tax (PBIT) instead of net income to calculate the profit margin.
We can also calculate the return on assets by breaking down into profit margin and total asset turnover.
The formula is then re-written as follow:
Return on Asset (ROA) = Profit Margin × Total Asset Turnover
Or ROA = (Net Income/Net Sales) × (Net Sales/Average Total Assets)
Both total asset turnover and profit margin contribute to the overall operating efficiency of a business. Thus, based on the calculation of total asset turnover and profit margin above, we can compute the return on assets by using the combination of these two ratios as follow:
Return on Assets = 6.43% × 1.505 = 9.68%
From the calculation above, the return on assets of ABC Co is 9.68%. This indicates that ABC Co generates 9.68% of its profit from using the total assets.
This percentage alone cannot be judged whether it is good or not. We should look at the trend as well as the relevant industry average to get more insights.
(3). Return on Common Stockholders’ Equity
Return on common stockholders’ equity is also known as return on equity (ROE). This ratio measures the profitability compares to the common stockholders’ equity meaning that it measures how much net income the company generated for its owners or common stockholders.
We can calculate the return on common stockholders’ equity by dividing the net income after deducting the dividend for preferred stock with average common stockholders’ equity.
The return on common stockholders’ equity formula is as below:
Return on Common Stockholders’ Equity = (Net Income – Preferred Stock Dividend)/Average of Common Stockholders’ Equity
From the financial data of ABC Co above, we can calculate the return on common stockholders’ equity as follow:
| 20X9 | |
| US$’000 | |
| Net Income (A) * | 33,478 |
| Preferred Stock Dividend (B) | 0 |
| Opening Common Stockholders’ Equity | 125,600 |
| Closing Common Stockholders’ Equity | 180,500 |
| Average Common Stockholders’ Equity | 153,050 |
| Return on Common Stockholders’ Equity | 21.87% |
* We can also use the profit before interest and tax (PBIT) instead of net income to calculate the profit margin.
From the calculation above, the return on common stockholders’ equity is 21.87%. This indicates that ABC Co generate a good net income for its common stockholders’ equity.
However, to be more precise, we need to look at trend as well as the industry average data for the relevant industry.
(4). Return on Capital Employed (ROCE)
Return on Capital Employed is another profitability ratios that measures the overall operating efficiency of capital employed. The capital employed here refers to the total assets minus current liabilities or we can say it is the sum of total equity and long-term liabilities.
The ROCE is calculated by dividing the profit before interest and tax with capital employed.
We commonly used PBIT instead of net income to calculate the ROCE.
Return on Capital Employed formula is written as below:
ROCE = PBIT/Average Capital Employed
From the financial data of ABC Co above, we have the information as below:
| 20X9 | |
| US$’000 | |
| PBIT (A) * | 59,278 |
| Opening Capital Employed (B) | 210,000 |
| Closing Capital Employed (C) | 360,600 |
| Average Capital Employed [D = (B+C)/2] | 285,300 |
| Return on Capital Employed – ROCE (E = A/D) | 20.01% |
*Adjusted PBIT after adding the interest income
From the calculation above, the ROCE of ABC Co is 20.01%. This indicates that the overall operating efficiency of using the capital employed to generate profit is good. Normally, the good ROCE is ranging from 10% to 15% depends on the industry.
Thus, to be more precise, ABC Co need to compare with the industry average to see its position as compare to the relevant industry.
Market Prospect Ratios
Market prospect ratios is the last building block of financial statement analysis. In this building block, the analysis on the market prospect ratios are very useful for corporations whose shares are publicly traded. This financial analysis technique as market measures use stock price that reflect the expectation of the publicly traded market. There are two main ratios in the market prospect. These are price-earnings ratio and dividend yield.
(1). Price-Earnings Ratio (P/E Ratio)
Price-earnings ratio is one of the market prospect ratio that measures the relationship between market value of common stock against earnings per share. This ratio is computed by dividing the market value of common share with earnings per share.
The price-earnings ratio formula is as follow:
Price-Earnings Ratio = Market Value per Common Stock/Earnings per Share
Or P/E Ratio = Total Market Value of Common Stock/Total Earnings
In order to calculate the P/E Ratio, let’s assume that ABC Co has the basic earnings per share of $0.61 and$0.49 for 20X9 and 20X8 respectively. In addition, let’s assume further that at the start of fiscal year 20X7 and 20X8, the market share price of ABC Co are at $23.9 and $30.41 respectively.
Additionally, let’s also assume that the market industry average for the same industry of ABC Co is at 37.1 of P/E ratio.
Thus, we can calculate the P/E Ratio of ABC Co as follow:
| 20X9 | 20X8 | |
| Market Value per Share (A) | 30.41 | 23.9 |
| Earnings per Share – EPS (B) | 0.61 | 0.49 |
| P/E Ratio (C = A/B) | 49.85 | 48.78 |
From the calculation above, ABC Co has its P/E ratio at 49.85 and 48.78 for 20X9 and 20X8 respectively which is higher than the industry average. This indicates that there is higher investors’ expectations of growth of earnings.
This very good sign for the company and would lead to further increase of share price.
(2). Dividend Yield
Dividend Yield is another market prospect ratio that measures the dividend paying performance of a corporation. This ratio is commonly used to compare performance of dividend payment of a corporation. It is computed by dividing the annual cash dividend per share with market value per share.
Dividend yield formula is as follow:
Dividend Yield = Dividend (in Cash) per Share/Market Value per Share
From the financial data provided, ABC Co did not declare nor pay cash dividend for both years, 20X9 and 20X8. Thus, there is zero cash dividend.
Therefore, we can calculate the dividend yield as follow:
Dividend Yield = 0/30.41 = 0.0%
In some circumstances, a corporation may consider not to distribute any dividend for any fiscal years. This is because they want to keep the accumulated profit as retained earnings and use it for further investment needed.
Conclusion
Financial analysis is very crucial not only for the management of the company itself but also for all kind of both internal and external stakeholders. There are three main financial analysis techniques or tools that we generally use in order to analyze financial statements. These include the horizontal analysis, vertical analysis and financial ratios. As an financial analyst, he or she should use such techniques and interpret the result carefully.