In this article, we will cover the six common performance measures for inventory management. This performance measures are sometimes called performance metrics or performance indicators (KPIs). Inventory management plays a key role in business efficiency. Businesses adopting lean manufacturing and total quality management approaches are particularly keen on inventory management. Efficient inventory management can affect a business with its production, sales, and revenue, and eventually with profits. Depending on business size and nature, inventory management measurement can be performed in quantifiable and qualitative measures. These key performance indicators or performance measurement tools for inventory should be set in line with business objectives. All performance measures and KPIs need to be set in a way to contribute towards performance enhancement for the business.
Setting Up the Performance Measures and KPIs
Performance measures can only be useful is the performance indicators are set correctly. The key performance indicators and all qualitative performance measurement tools should be set in line with business strategic objectives.
- Set SMART performance measurement indicators i.e. Specific, Measureable, Achievable, Realistic, and Timely
- KPIs should be set and appraised to contribute towards business objectives and goals
- Set KPIs according to performance measurement rules set by the company as it will also affect the staff performance appraisals
Once the KPIs are set realistically, then measuring these KPIs becomes easier. We’ll discuss some of the common performance measurement tools in inventory management.
1. Inventory Turnover Ratio
Inventory turnover ratio is one of the performance measures or KPIs for inventory management. This is the traditional and most commonly used inventory management performance indicator. It is an important manufacturing and operational efficiency measurement tool. It provides an important link between the optimum levels of inventory and its turnover to sales. We can calculate the inventory turnover ratio as follow:
Inventory Turnover Ratio = Cost of Sales ÷ Average of Inventory. Where,
Average of Inventory = (Closing Inventory + Opening Inventory) / 2.
The use of average inventory typically would help to eliminate or remove any seasonal fluctuations or any unforeseen one-time events. The use of the cost of goods sold metric indicates that the company will be interested in manufacturing, raw material, operations, and marketing expenses.
Example:
Cost of Goods Sold or Cost of Sales = $ 200,000. Opening Inventory = $ 80,000. Closing Inventory= $ 10,000.
Average Inventory = (80,000 + 10,000)/2 = $ 45,000. So our Inventory turnover ratio,
Inventory Turnover Ratio = 200,000 / 45,000 = 4.44
This result indicates that the company has successfully sold the inventory more than 4 times during the set period. This sole ratio cannot provide any results; it should be compared against historical ratio of the company as well as the industry standards. Both favorable and unfavorable variations in results can be due to changes in the cost of goods sold due to higher raw material prices, operational costs, and labor costs or due to changes in inventory levels.
2. Average Days to Sell the Inventory Ratio
This is second performance measure for inventory management.This ratio is often calculated together and is closely linked with inventory turnover ratio. The inventory turnover calculates the number of times inventory has been sold, and days to sell ratio tells the number of days to sell the inventory.
It can be easily calculated as:
Inventory Days to Sell Ratio = (Average Inventory / COGS) × 365 Days
From our previous example:
Inventory Days to Sell Ratio = (45,000 / 200, 000) × 365 = 82.125 Days.
The company takes over 82 days to turn the inventory into sales. The interpretation of this ratio should also be matched with previous company records and industry standards. This ratio provides more information about the operational efficiency of the company. Basically, the lower the number of days of the inventory days to sell ratio, the better it is for the company.
3. Inventory Carrying Costs
The third KPI is inventory carrying costs. Although these costs are straight forward to calculate with assessing warehouse and storage expenses, total cost figures alone cannot describe the efficient usage of space. If we divide the total inventory warehouse or holding costs by the total inventory value, we can get the link between each dollar spent on inventory holding. It can be calculated as:
Inventory Carrying Cost = Total Inventory Value ÷ total inventory Costs
For example,
Inventory Cost = $ 70,000 and Total Inventory= $ 300,000. Then,
Inventory Carrying Cost = 70,000 ÷ 300,000 = 0.2333 or 23.33%
It shows that the company is spending 0.23 dollars on each $ 1 value of inventory as its carrying cost.
4. Economic Order Quantity Management (EOQ)
The fourth performance measure for inventory management is EOQ. Companies adopting lean manufacturing and JIT approaches require robust raw material supplies. Holding too much inventory increases carrying costs or inventory holding costs and too low inventory can create a stock-out situation. Economic order quantity points a company for an optimum level of units it should with each manufacturing batch. This method can reduce inventory holding costs. EOQ also increases supply chain management and efficiency in inventory management. EOQ is calculated to see the optimal ordering quantity of inventory that help the company to minimize costs.
We can calculate the EOQ by using the below formula:
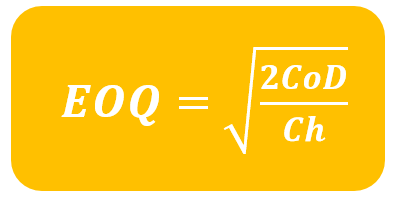
Where:
- Co is the cost of placing an order or ordering cost per order
- D is Usage in units for one period. It is also commonly called demand.
- Ch is inventory holding costs per unit for one period
Example:
ABC Co has the annual demand for inventory for 60,000 units per year. This demand is generally at a steady rate. Typically, it costs US$30 to place an order and 4o cents to hold one inventory unit for a year. Calculate the order size to minimize inventory costs, the number of order placed each year, the length of inventory cycle as well as the total costs of holding inventory for the year.
Solution:
We can calculate the economic order quantity (EOQ) by using the formula below:
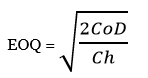
Where: Co = US$30 per order
D = 60,000
Ch = 40 Cents per unit per year
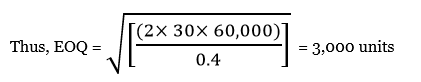
Thus, the company need to order 3,000 units per order in order to minimize the inventory costs.
The number of orders each year can be calculated as follow:
Number of Order = 60,000 / 3,000 = 20 orders.
The inventory cycle time is therefore calculated as follow:
Inventory Cycle Time = 52 weeks / 20 orders = 2.6 weeks.
Last but not least, the total inventory costs at the optimum order level is calculated as follow:
Inventory Cost = (20 × 30) + [(3,000/2) ×40 C] = US$1,200 per year.
5. Inventory Backorders Rate
The fifth performance measure of inventory management is inventory backorders rate. Sometimes due to seasonal demand or with a successful new product launch, the company may face a shortage of stocks. Even though customer demand exists but the company cannot meet that demand due to lack of capacity or lack of inventory in warehouses. In this case, the company has to put customers on hold for their orders. It can be calculated as:
Backorder Rate = (unfulfilled orders ÷ Total number of orders) × 100.
Some companies adopting lean manufacturing and having reliable suppliers can quickly fulfill customer demands and remove the backorders. If the situation repeatedly exists, then the management must look into the supply chain and inventory management.
6. Rate of Inventory Return
The last common performance measures for inventory management is the rate of inventory return. This KPI is linked with finished goods returning due to any damage or fault in the final product. This indicator can sometimes lead to inventory management issues such as usage of low-quality raw material or faulty design feature finishing.
Apart from these quantitative inventory management KPIs, the business can also use some qualitative measures. Some performance indicators cannot be measures in absolute terms but remain important factors for inventory management.
Some other important inventory management related indicators are listed:
- Inventory Forecast Accuracy: The term is self-explanatory as it deals with the planning and forecasting of inventory. Forecasting inventory planning cannot be done accurately and error free, as by the time manufacturing starts many market conditions change. However, the business should focus on making as accurate inventory forecasts as possible.
- Inventory Service Level: it can be linked with stock-outs. This indicator points out any shortage of inventory when an order is placed. Accurate forecasts and optimum level of inventory can reduce the stock-outs and increase the inventory service level.
- Lead Time: it denotes the total time taken with an inventory order is placed with the supplier. It can also be a good performance measure in supply chain management. Lead time directly links with the supplier reliability.
Businesses can opt for many inventory management control measures. Selection of Inventory management methods such as a JIT approach, choice of inventory cost calculation method such as LIFO, FIFO, or weighted average cost will impact the inventory performance measurement. Any inventory performance measurement ratio or KPI indicator can provide no useful results unless it is compared against industry or company standards.