In this article, we will cover the degree of operating leverage. This includes the key definition, how to calculate the degree of operating leverage as well as example and analysis. Before, jumping into detail, let’s understand some key relevant definitions.
Table of contents
Definition
Let’s understand some key definition of operating leverage as well as the degree of operating leverage (DOL).
What is Operating Leverage?
Operating leverage is defined as the potential use of fixed operating costs to magnify the effect of changes in sales revenue of a company on its profit before interest and tax (PBIT) or earnings before interest and tax (EBIT).
That’s mean operating leverage relies upon the existence of fixed operating costs in order to generate the revenue stream of a company.
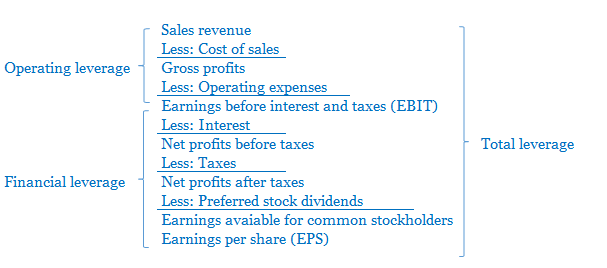
Below is illustration of the operating leverage in relation to the financial leverage:
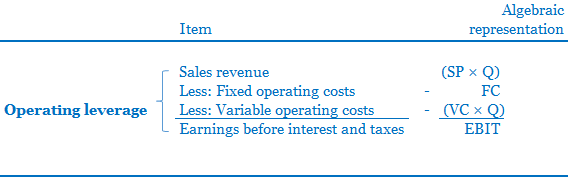
Or alternatively, we can illustrate the operating leverage as below:
What is Degree of Operating Leverage (DOL)?
Degree of operating leverage (DOL) is defined as the measurement of the changes in percentage of earnings against the changes in percentage of sales revenue. DOL is also known as the financial ratio that a company uses to measure the sensitivity of its earnings as compare to sales revenue. The earnings here refers to the earnings before interest and tax (EBIT).
How to Calculate Degree of Operating Leverage?
The calculation of DOL simply dividing the percentage change in EBIT with the percentage change in sales revenue of a company.
Degree of Operating Leverage Formula
We can write down the formula of DOL as below:
Degree of Operating Leverage (DOL) = Percentage change in EBIT/Percentage change in sales revenue
Alternatively, we can also calculate the DOL by using the below formula:
DOL = [Q × (SP – VC)]/ [Q× (SP – VC) – FC]
Where:
Q = Total units of sales
SP = Selling Price
VC = Variable Operating Cost
FC = Fixed Operating Cost
Example
We have extract data from ABC Co as below:
| US$ | US$ | US$ | |
| Sales (in units) | 500 | 1,000 | 1,500 |
| Sales revenue | 5,000 | 10,000 | 15,000 |
| Less: Variable operating costs | 2,500 | 5,000 | 7,500 |
| Less: Fixed operating costs | 2,500 | 2,500 | 2,500 |
| Profit before interest and taxes (PBIT) | 0 | 2,500 | 5,000 |
Note: The selling price per unit is $10 and variable operating cost per unit is $5.
Required:
- Calculate the degree of operating leverage of ABC Co for the change from 1,000 units to 500 units (case 1) and from 1,000 units to 1,500 units (case 2).
- ABC Co changes its proportion of fixed and variable operating costs by eliminating the commission of sales person and increasing the fixed salary instead. The total commission that ABC Co eliminated results in the reduction of variable operating costs per unit from $5 to $4.5. However, the fixed operating costs increase from $2,500 to $3,000. Calculate the new DOL as result of this changes in proportion of fixed and variable operating costs.
Solution
- Calculate the degree of operating leverage for both cases
Before we calculate the DOL, let’s see the operating leverage graph showing the relationship between EBIT and the changes in sales revenue in relation to the total operating costs. From the example above, we can illustrate the operating leverage as per the chart below:
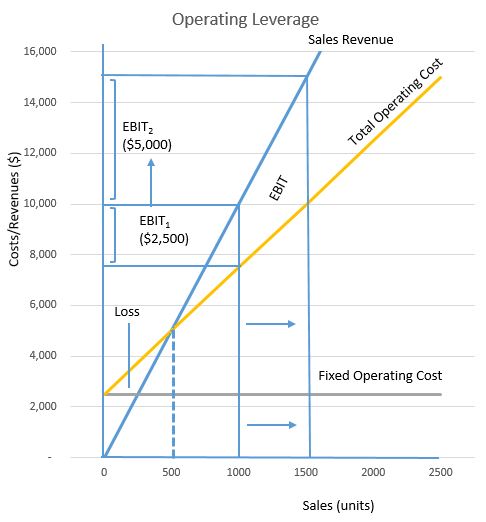
If the sales increase from 1,000 units to 1,500 units (50% increase), the EBIT will increase from $2,500 to $5,000.
However, if the sales decrease from 1,000 units to 500 units (50% decrease), the EBIT will decrease from $2,500 to 0). Finally, if the sales below 500 units, the company will be at loss position.
Now, let’s continue to compute the degree of operating leverage.
By using the DOL formula below, we can calculate the DOL as follow:
Degree of operating leverage (DOL) = Percentage change in EBIT/Percentage change in sales revenue
From the above example, we can calculate the percentage change for both cases as follow:
Case 1:
Percentage change in EBIT = (0 – 2,500)/2,500) = -100%
Percentage change in sales = (5,000 – 10,000)/10,000 = -50%
Case 2:
Percentage change in EBIT = (5,000 – 2,500)/2,500) = 100%
Percentage change in sales = (15,000 – 10,000)/10,000 = 50%
Therefore, the DOL calculation is as follow:
Case 1:
DOL (Case 1) = -100$/-50% = 2
DOL (Case 2) = 100%/50% = 2
Alternatively, we can calculate by using the second DOL formula as follow:
DOL = [Q × (SP – VC)]/ [Q× (SP – VC) – FC]
Where: Q = 1,000 units (For base sales level)
SP = $10/unit
VC = $5/unit
FC = $2,500
Hence, DOL = [1,000 × (10 – 5)]/ [1,000 × (10 – 5) – 2,500] = 2
This indicates that every 1% changes in sales revenue will lead to the changes of earnings of the company of 2%.
2. Calculate the new degree of operating leverage when there are changes of proportion of fixed and variable costs.
We will use the second degree of operating leverage formula to calculate these changes as below:
DOL = [Q × (SP – VC)]/ [Q× (SP – VC) – FC]
Where:
Q = 1,000 units (the base sales level)
SP = $10 per unit
VC = $4.5 per unit
FC = $3,000
Thus, new DOL = [1,000 × (10 – 4.5)]/ [1,000 × (10 – 4.5) – 3,000] = 2.2
This indicates that every 1% changes in sales revenue will lead to the changes of earnings of the company of 2.2%.
Analysis and Interpretation
The degree of operating leverage typically indicates the impact of operating leverage on the earnings before interest and taxes of a company. It measures the effect of the fixed operating and variable operating costs on the operating profit.
The DOL is greater than 1 indicates that the operating leverage exists. It means that the change in sales leads to a more earnings before interest and taxes after accounting for both variable and fixed operating costs.
Basically, when there is a shift to more fixed operating costs in relative to variable operating cost, there will be greater degree of operating leverage.
As you can see from the example above, when there are changes in the proportion of fixed and variable operating costs, the degree of operating leverage will change. ABC Co reduces its variable commission from $5 per unit to $4.5 per unit and instead increase the level of fixed operating costs from $2,500 to $3,000. These changes result in the increase of degree of operating leverage from 2 to 2.2.
Conclusion
The degree of operating leverage is an important indicator to measure the relative changes of earnings compare to changes in sales revenue by taking into account the proportion of fixed and variable operating costs.
When there are changes in the proportion of fixed and variable operating costs, thus the changes in sales quantity will lead to the changes in the degree of operating leverage.